Strategy
Articles on focus, positioning, and sustainable growth.
Search

Articles on focus, positioning, and sustainable growth.

Notes on brand identity, communication, and premium management.

Articles on AI, data, and digital transformation.

Articles on behavioral marketing, cognitive biases, and consumer psychology.
Erkan Terzi analysed the organic reach, engagement and click-through rates of Facebook and Twitter across 10 posts, offering a comparative assessment for digital marketers.
18 September 2015 / Marketing Türkiye — How about questioning which of Facebook and Twitter — two of the most-used social channels in Türkiye and globally — is more effective and engaging for us digital marketers? Of course, the feedback you receive will vary depending on the industry, the nature and tone of your content. Still, let's approach this as a general assessment based solely on organic statistics.
For this analysis, we will work with 2 accounts and evaluate the results of 10 posts. This is an analysis carried out within the brand using exactly the same text and visuals. The followers of the relevant Facebook and Twitter accounts are not made up of meaningless users such as like-counter or egg Twitter accounts, but of users genuinely interested in the brand and choosing to follow it. The posts cover the brand's different categories and are entirely ad-free — only organic posts were considered.
Algorithm Analysis
First, let's look at the organic reach rate of the 10 posts relative to the total follower count. The formula we use here is: Impressions / Total Followers.
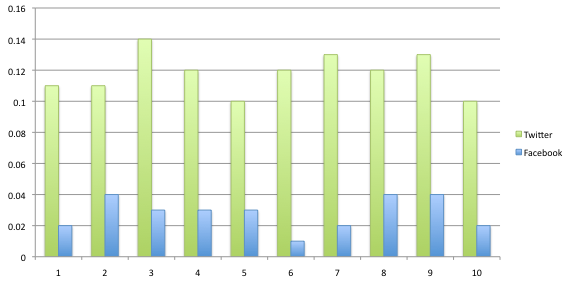
The data clearly shows that organic post reach has dropped significantly, especially after Facebook's recent algorithm updates. Twitter's reach rate, as a percentage, is higher than Facebook's. This indicates that the work you do on Twitter is more effective. At least on the organic side, the metrics favour Twitter; the paid side is not part of this assessment. For both channels, I can comfortably say that Facebook leads thanks to the strength of its advertising tools, but I cannot say the same on the organic side.
Engagement Analysis
Another analysis looks at the engagement rate the channels achieved on the 10 posts. The formula here is: Engagement Count / Post Impressions.
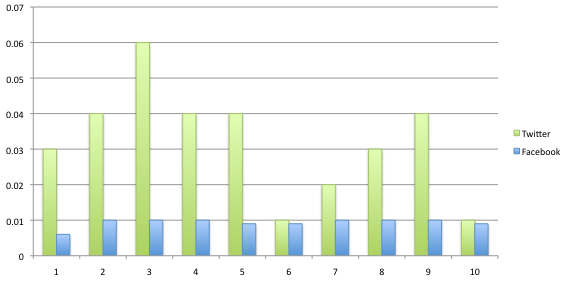
As shown here, Twitter is clearly ahead. Don't be surprised by these engagement rates. Engagement on Twitter typically ranges between 10% and 15%. On Facebook, the same range is 1% to 5%.
Another point I want to highlight is this: out of these 10 posts, only the 3rd is a holiday greeting post; the others were made for different product categories. Look in particular at how Twitter responded to this post! I cannot say the same for Facebook.
Click Counts
Another assessment looks at the number of clicks on the links in our posts that lead to our website or to other sites. We are again evaluating the results of 10 posts, but because some posts — such as holiday greetings — did not include click-through links, I have taken the figures based on the total.
The formula we used: (Total Clicks / Total Impressions of Posts) × 100.
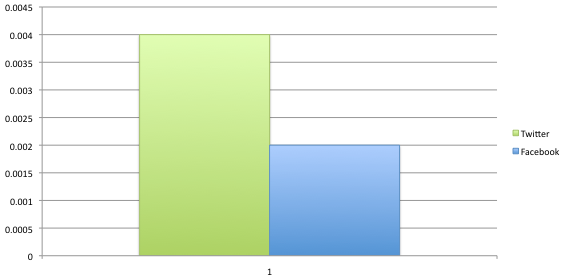
According to the results, Twitter is once again the winner — by a factor of two. Let me put it plainly: in the days of Facebook's old algorithm, we used to allocate the lion's share of investment to this channel. We didn't ignore Twitter, but Facebook was the priority for us. Yet things changed when the Facebook algorithm changed. Of course, social media's structure, content sharing patterns and user reactions in our country have shifted over time for various reasons, but where we have arrived today is essentially what this short analysis shows.
Another important point: because the number of Facebook users in Türkiye exceeds Twitter, the potential customer reach across the two channels appears higher on Facebook. However, unless you have a very large budget, the user count you can reach on either channel doesn't matter much. Beyond that, the cost of reaching a user via advertising is currently more favourable on Facebook; this should be an important factor in your new strategies.
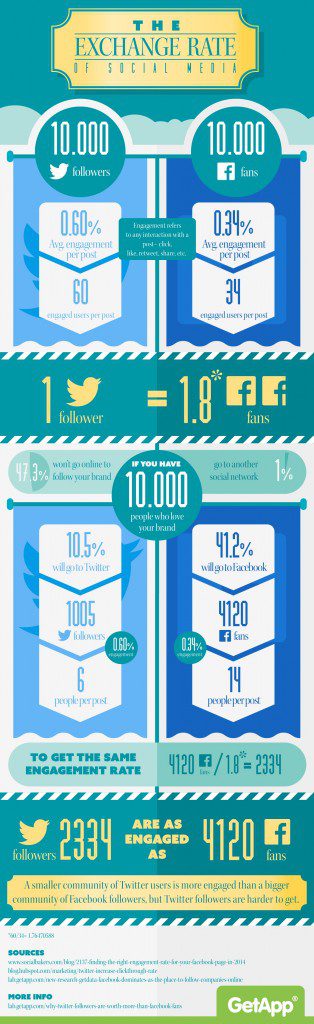
Now set all of this aside. I'll present a different set of data. Let's see what this GetApp study tells us — Twitter, you say?
This article was updated on 23.07.2015.